MetGIS Pro+
Operating instructions

Operating instructions
The map below shows the basic functions of MetGIS Pro+:
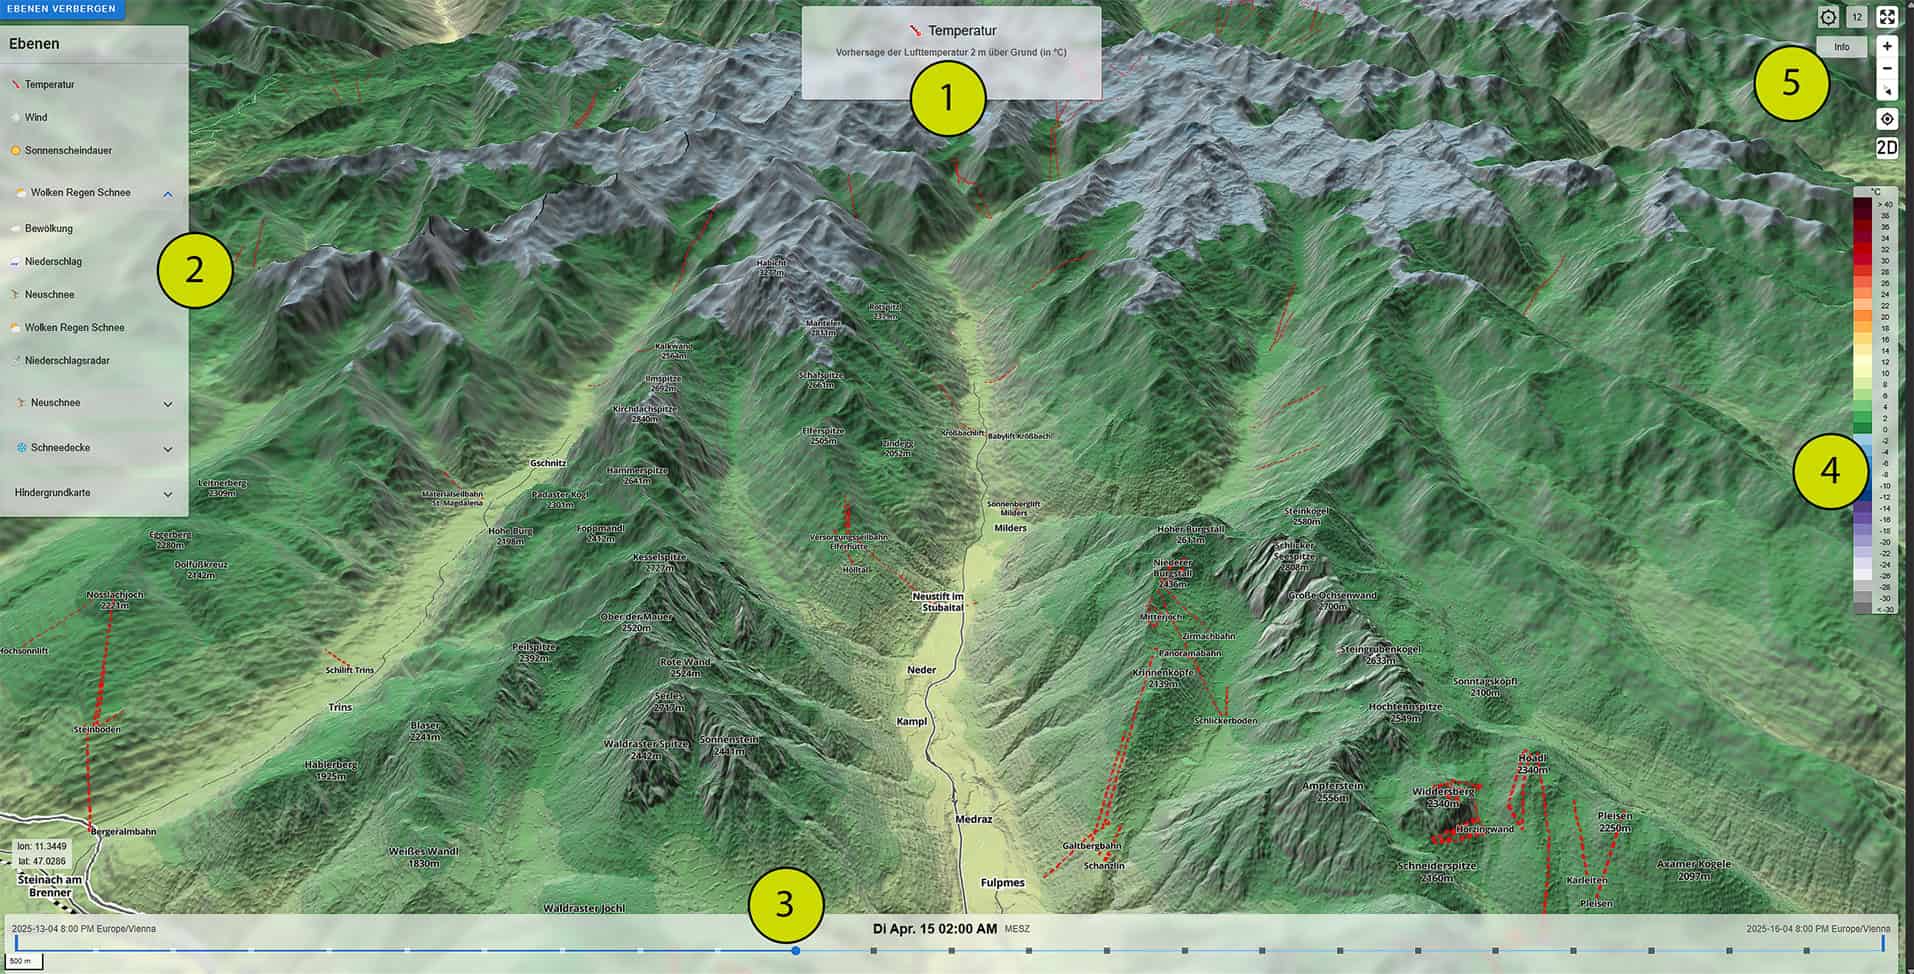
Important buttons at a glance
Info: User Manual
Top row:
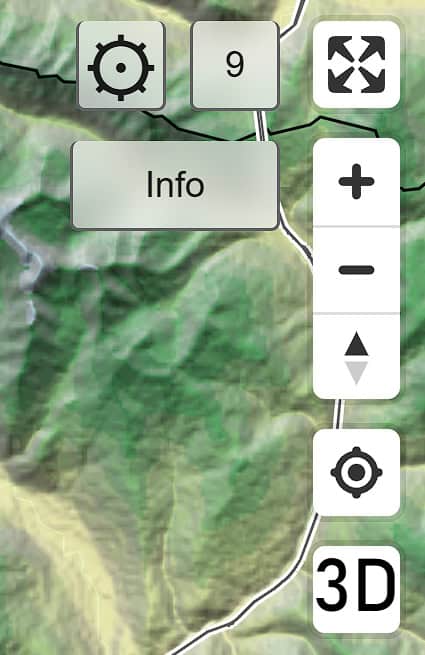
Right-hand column:
Info: This is where you will find useful information on how to use MetGIS Pro+. This also includes a list of the available weather variables and their interpretation.
Gear wheel: Use this setup area to change the most important settings regarding language, units for weather parameters and 3D visualization:
Zoom level (number) – This shows the current zoom level of the map. This number changes as you zoom in and out of the map using the mouse wheel (desktop), pinch gesture (mobile) or the + and – keys. The zoom level can range from 3 (world map) to 15 (detailed map).
Four arrows button: Allows you to run the application in full screen mode. To exit this mode, select the button again.
+ Zoom in to see more details
– Zoom out to get an overview of the map
Compass needle: Once the map has been rotated, you will be able to use the compass needle to point it back to the North.
Target: If this function is enabled and then activated in the browser, your current location can be determined and displayed on the weather map.
3D or 2D: If you are in 2D mode, the 3D button will appear. Activating this button will take you into 3D visualisation mode. If you are in 3D mode, a 2D button will appear instead to exit 3D mode and return to 2D view.
On the desktop, you can use the mouse to control and change the map view as required. You can use the left mouse button (click and hold and move the mouse) to change the position of the map or to move around on the map. You can use the right mouse button (click, hold and drag) to rotate and tilt the map, i.e. change the viewing angle.
On mobile devices, use your fingers to navigate. To zoom, use a pinch gesture (pinch your fingertips together). To rotate the view on a smartphone, place one finger on the screen and rotate the view by moving another finger in the desired direction.
You will find the scale of the map in the bottom left-hand corner of the screen. The same applies to the longitude and latitude of the location at which the mouse pointer is currently positioned.
To display the forecast for selected points, proceed as follows:
The display is in the form of a table containing both numerical values and graphical weather icons. You will now see forecast time series of all relevant forecast parameters, the current weather, and the longitude, latitude and altitude of the selected point:
Selecting individual days in the forecast table will display a further table of hourly or three-hourly values for that day. You can close this view using the X in the top right-hand corner.
Temperature: Air temperature two meters above ground, in degrees Celsius (°C) or Fahrenheit (°F). These maps have a particularly detailed structure due to their adaptation to the high-resolution terrain.
Wind: Wind speed and direction 10 m above the ground, in kilometers per hour (km/h), meters per second (m/s), miles per hour (mph) or knots (kn).
Sunshine duration: Duration of sunshine for three-hour intervals, in hours (h).
Clouds – Rain – Snow: Combined weather map showing at one glance the areas where there is cloud cover and where it is raining or snowing. Cloud cover is given as a percentage of sky coverage. Amounts of rain (in mm or inches) and fresh snow (in cm or inches) refer to three-hour intervals. Rain includes sleet without snow cover.
Cloud cover: Indicates what percentage of the sky is covered with clouds. The value range is 0 to 100 %. 0 % stands for cloudless weather, 100 % for a completely overcast sky. 75 % cloud cover means, for example, that three quarters of the sky is covered with clouds.
Precipitation: Amount of precipitation that has fallen in three-hour intervals, in millimeters (mm) or inches (in). In the case of rain, this is simply the amount of rainwater, and in the case of snowfall, the water that would remain after the fallen snow has melted (snow water equivalent). The unit mm is identical to the unit liters per square meter (l/m2). This means that a precipitation amount of 10 mm means that 10 liters of water have fallen per square meter.
Fresh snow: Amount of fresh snow for three-hour intervals, in centimeters (cm) or inches (in). The areas of fresh snow appear particularly highly structured on the maps due to the adaptation to the high-resolution terrain.
Precipitation radar: The precipitation radar maps provide a real-time display of the current precipitation. In contrast to most other weather variables, no forecast is provided, but values measured by precipitation radar stations are presented, some of which have been post-processed and edited. Precipitation radar data is only available for a limited number of areas.
Fresh snow 0-24 h, fresh snow 24-48 h, fresh snow 48-72 h: Displays the amount of fresh snow for 24-hour intervals. The fresh snow depth is available for the next 24 hours, 24-48 hours, and 48-72 hours from the time of the query. The units used are centimeters (cm) or inches (in).
Snow cover: This Snow Cover Master Map shows which areas are currently covered by snow. The thickness of the snow cover (snow depth) cannot be determined from this map. The map is created using data from various satellites (Sentinel-2, MODIS) and internal MetGIS model calculations and provides the best snow cover information that MetGIS has to offer. The horizontal resolution of the snow cover map is up to 30 meters. Snow cover data is currently only available for a few major mountain ranges (Alps, Pyrenees, part of the Andes).
Snow cover Sentinel: This snow cover map is based exclusively on the measurements of the Sentinel-2 satellites of the European Space Agency ESA.
Snow cover Modis: The MODIS snow cover data comes from the Terra and Aqua satellites of the American space organization NASA.
Snow information age: Indicates when the information on the snow cover map was last updated. This depends on the exact flight path of the satellites and the cloud cover conditions and can vary from area to area.
Snow information source: Indicates where the information on the snow cover map comes from. Depending on the geographical region and weather conditions, the sources of information are either satellites (Sentinel-2, MODIS) or weather simulation models from MetGIS.
Background map: Here you can choose between different background maps, such as MetGIS, EOX or OpenStreetMaps.
Current weather: Current air temperature, felt temperature, wind speed and direction, cloud cover, and intensity of rain and snowfall
Temperature: Forecast of minimum and maximum air temperature, temperature distribution over the day in one-hour intervals
Precipitation: Forecast of rain and fresh snow (both daily totals and hourly totals), probability of precipitation
Wind: Forecast of wind speed and wind direction (daily and hourly values)
Sun: Time of sunrise and sunset, forecast of sunshine duration (daily and hourly)
Humidity: Forecast of relative humidity (daily average and hourly values)
MetGIS calculates air temperature using a proprietary algorithm that incorporates high-resolution terrain data into the forecast process. The temperature is accurately adjusted for altitude, taking into account the average decrease in temperature with increasing altitude.
While the temperature forecast is often very accurate (especially during windy weather conditions and precipitation periods), inaccuracies occur primarily during temperature inversions (weather conditions where the temperature increases with altitude). The largest deviations between predicted and measured temperatures are to be expected during calm high pressure conditions in the winter months in inner alpine basins and valleys.
The accuracy of the MetGIS precipitation forecast depends on the weather situation. Precipitation is most accurate for large scale precipitation events, such as those associated with warm fronts. For small-scale precipitation, such as those associated with thunderstorms, especially in the warm season, the average precipitation over larger areas is well described, but locally much larger amounts of rain may occur than predicted.
The Precipitation Radar provides high resolution, spatially and temporally comprehensive quantitative precipitation data in real time. This is achieved by a combination of observations at precipitation stations and the recording of precipitation by weather radars. These data are obtained from the routine procedure RADOLAN (Radar-Online-Aneichung) of the DWD (German Weather Service / Deutscher Wetterdienst). The disadvantage of precipitation radars is that only signals above a certain height can be detected. They can also be affected by shading from the terrain or distortion of the echo by small obstacles such as trees, transmission towers, and flocks of birds. These disadvantages can to some extent be partly compensated by including ground measurements.
MetGIS uses a specially developed algorithm to calculate the amount of new snow that not only accurately determines the snow line but also incorporates high-resolution terrain data into the forecast process.
The calculated value can be thought of as the amount of new snow that reaches the ground during the snowfall. There are several reasons why this value may differ from the measured value. For example, the calculation scheme does not take into account the transport of the snow by wind, the melting process, and the settling of the new snow. The latter two factors mean that the calculated value is often somewhat higher than the measured value during heavy snowfall and longer reference periods (especially 24 hours and more).
Relative humidity (expressed in %) is one of the most difficult weather parameters to predict because changes can occur in the smallest of spaces. Small sources of moisture such as ponds, wet meadows, groups of trees and melting snow can have a large local influence on this weather parameter. However, the MetGIS forecasts can still predict the average humidity over larger areas satisfactorily, in part because this weather parameter is adjusted for altitude. However, when interpreting humidity from MetGIS, it should not be assumed that the accuracy is in a smaller percentage range.
Cloud cover information from MetGIS should be interpreted as the average percentage of sky coverage over a larger area. Similar to precipitation, large-scale weather systems are well captured.
However, the exact location of clouds with a small horizontal extent of a few kilometers (e.g. cumulus clouds) cannot be reproduced. These types of clouds occur mainly when the atmosphere is unstable. Examples are summer weather with showers and thunderstorms.
The problems with cloud prediction also affect the prediction of sunshine duration. There are also several limitations, such as the shading effects caused by steep terrain, or the question of how to evaluate sunrays that have limited penetration through thin clouds.
MetGIS uses high resolution topographic data to adjust wind speed to altitude. As a result, significant differences in wind speed between valleys and nearby mountain peaks can be well described in a very small area. However, very small local effects such as air currents around hilltops are not captured by the MetGIS algorithm. In addition, MetGIS may slightly overestimate the actual wind speed at high altitudes.
The snow cover maps from MetGIS are characterized by their high resolution and full zoom capability. They are based not only on satellite data (Sentinel-2, MODIS), but also on fresh snow data from the high-resolution weather model developed by us. This is important because the satellites used do not see through to the ground (and any snow cover) when there is cloud cover. During longer periods of bad weather, there would be no up-to-date snow cover information without the inclusion of fresh snow.
The most accurate snowpack information is over areas recently overflown by the Sentinel satellite. This satellite scans every point on earth at a particularly high spatial resolution of 30 meters. Overflights take place every few days. In the worst case, however, it can also happen that the data for individual regions of the map cannot be updated for a longer period of time. There is a risk of this if there is a persistent winter cloud cover and at the same time, according to the forecast model, there is no heavy snowfall.

Meteorologe, Entwickler des Designs des MetGIS Prognosesystems
Curriculum vitae
This will close in 0 seconds
This will close in 0 seconds